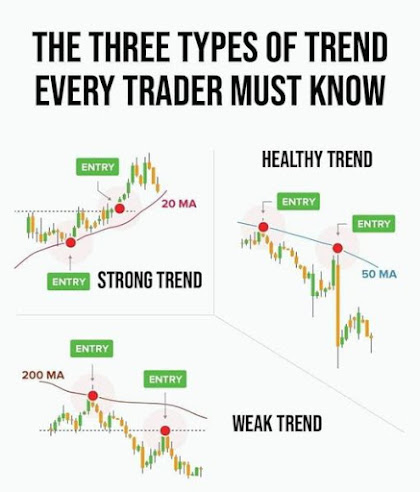
Chart Patterns Analysis:-
First of all before the enter Trade watch the chart clearly. if you find any map Design then draw trand line on graph. if tradnd break out then wait 4 to 6 candel in break out derction and enter trade on retest. if market no break out only reversal mode then wait 4 to 6 candel any time frame who use on trade in our reversl mode and enter the trade with SL and tp 1/3 risk reward same like
Our analysis chart H4 time frame;-
NZDUSD H4 Time frame analysis on sell entry October 20 /2020
after 2 days october 28 market reach our TP | Take profit | point .you can see the chart live session .


0 Comments